Saturday, August 31, 2013

Made-for-Web Video Remakes the TV Landscape

Viewers tend to have the same reaction to TV and video ads

A new wave of made-for-web video content has redefined what it means to watch television, according to a new eMarketer report, “Made-for-Web Video Content: The New TV.” eMarketer defines made-for-web video as programming created for digital platforms, including websites, desktop-based streaming apps and mobile apps.

Thanks to hits like Netflix’s “House of Cards,” it now matters little whether a show is delivered via cable, broadcast or Wi-Fi, or whether it’s viewed on a TV, laptop, tablet or smartphone. Consumers are making viewing decisions purely on the strength of the content, and advertisers are following their cues. These tectonic shifts in how programs are funded, distributed and viewed represent the biggest disruption in the television industry since the advent of cable.

Growth in overall digital and mobile viewing represents critical mass for content creators on new media platforms. There will be 204.6 million US digital video viewers in 2017, representing 78.1% of internet users and 62.7% of the general population. That’s an increase from 182.5 million in 2013, or 75.0% of internet users and 57.7% of US residents.


Original video content can be long- or short-form. In the longer-form category, Netflix, Hulu and Amazon are leaders, and the three services have each begun to introduce original content in the past few years.


In terms of the effect exclusive video content will have on subscriber numbers, a study by AYTM Market Research indicated just 37.1% of US internet users would consider paying for a streaming service if it had exclusive rights to a show they were interested in watching. The remaining 62.7% of respondents said they would “probably not” or “definitely not” subscribe on that basis.

Still, there are signs that, even at this early stage in its development, long-form made-for-web content is pulling viewers away from cable. In a June 2013 survey, CouponCabin looked at consumer attitudes toward pay TV services and discovered that 38% of US adult internet users streamed shows that were only available on streaming venues such as Netflix, Hulu and Amazon Instant Video.

While Netflix has taken an early lead in the world of full-length made-for-web video, YouTube has built a commanding lead in professional short-form programming.

comScore’s June 2013 ranking of YouTube partner channels found that VEVO was the most popular channel in terms of unique viewers and total videos.


Virtually all of the short-form, made-for-web content on YouTube and other venues is ad-supported. The same is true of full-length TV shows on Hulu and Hulu Plus. That means that, with the exception of subscription-only services such as Netflix or Amazon, enlisting the support of brand marketers is an essential strategy of content owners and platforms that cater to digital audiences.

Viewers don’t seem to make huge distinctions between TV and made-for-web video ads, either. A January 2013 Starcom study found that US internet users had similar attitudes toward ads during traditional TV and original streaming content. Feelings were slightly more polarized for streaming, with greater percentages of viewers reacting positively or negatively and fewer with neutral reactions. But the study did not indicate the kinds of statistical differences that would make marketers, content owners or streaming companies rethink the advertising model for online vs. traditional TV.


Take your video marketing to the next level.
Call Jeff at 888-712-8211 today!   


VMakers - Video made easy.
Trusted by Disney, Warner Bros, NBC, Paramount, CBS and ABC.
info@VMakers.com

Subscription Service Press+ Helps Monetize Video


Digital subscription platform Press+, which helps publishers add metered paywalls to their websites, launched a new tool on Wednesday that aims to help monetize video.

Unlike the Press+ article meter, which lets publishers specify a certain number of stories that readers can access free before they are asked to pay up, the Press+ video meter lets viewers watch a video for a few minutes before they’re asked to pay. The first publisher to use the tool is Courtroom View Network, a service that streams trials online.

Press+ cofounder Steve Brill told The Wrap that the videos likely to work best for this are longer ones “with some kind of narrative arc” and that “the way to get people into video stories is to let them watch it for a little while.”

Many publishers are experimenting with video, but so far the trend has been toward keeping it free. The New York Times, for instance, lifted its paywall on all video content earlier this year. “Part of the reason we’re doing this is because we’re already distributing on other channels like YouTube,” NYT EVP Denise Warren told my colleague Jeff Roberts at the time, “Since it’s already available…it seems inconsistent to keep it behind the gate.”

Meanwhile, the Huffington Post’s streaming video network, HuffPost Live, racked up 445 million views and over 13 million unique visitors a month in its first year.

Video efforts like these are all supported by advertising dollars, but Press+ cofounders Steve Brill and Gordon Crovitz say that publishers are eventually going to come to the same conclusion with video that they did with news: Ads aren’t enough.

And when publishers have put video behind a paywall, Crovitz said, they “make the mistake that some print publishers also made” by installing “a hard paywall, which not only slashes ad revenue but does not allow viewers to sample, to see our proven welcome messaging, and to get engaged in the product before being asked to buy it or to buy an upsell of a subscription to a package of videos.”-paidContent
Take your video marketing to the next level.
Call Jeff at 888-712-8211 today!   


VMakers - Video made easy.
Trusted by Disney, Warner Bros, NBC, Paramount, CBS and ABC.
info@VMakers.com

Thursday, August 22, 2013

Interactive Video Ads Double Purchase Intent

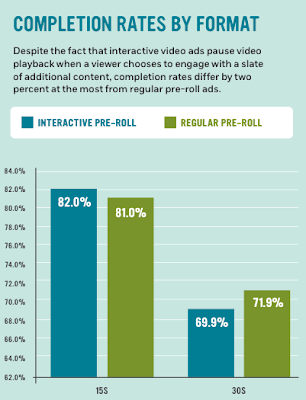
Research provided by TubeMogul, the leading programmatic brand marketing platform for video advertising, and Innovid, whose iRoll® format is the standard for interactive video — quantifies the benefits of interactive pre-roll to brand marketers.

Findings

Brand Lift: Interactive vs Regular Pre-Roll Video Advertising

Video Completion Rates by Format
Video Click, Interaction Rates by Format

Video Interaction Rates by Vertical

Methodology

Data for this report comes from top brand campaigns supported by Innovid and run through TubeMogul’s media buying platform, spanning hundreds of millions of impressions across pre-roll video ads globally. Brand lift data comes from TubeMogul’s BrandSights survey technology, which launched last year and has run hun- dreds of brand surveys on video campaigns.

For the purposes of this research, “lift” is defined as the absolute difference (subtraction) between the percent of correct answers of exposed viewers (people who saw the ad) and a control group (people that did not see the ad). “Correct” answers are defined as the answer that the brand desires and indicates a positive perception of the brand by the survey taker.

An interactive video ad “engagement” is defined as any action taken by a viewer to interact with an ad, usually hovering or clicking an icon to explore a slate of additional content. On a movie trailer, for instance, a viewer might hover to open a slate of content that lets them watch additional previews, find local showtimes and buy tickets – all within the ad unit itself. In most cases, when a viewer engages, the video’s playback is paused until the viewer closes out the additional content.


Conclusion

Interactive video advertising is a powerful tool for brand marketers. The format excels at driving awareness, loyalty and especially purchase intent as compared to regular pre-roll. With tools from Innovid and TubeMogul, advertisers can easily add interactivity to their video ads and dramatically increase engagement with their audiences.

Take your video marketing to the next level.
Call Jeff at 888-712-8211 today!   


VMakers - Video made easy.
Trusted by Disney, Warner Bros, NBC, Paramount, CBS and ABC.
info@VMakers.com

Wednesday, August 21, 2013

1 in 10 Online Americans Shared A Brand’s Video

11% of online Americans have forwarded a link to a brand or product’s video to someone, according to the latest survey wave release from Ipsos Open Thinking Exchange. The survey, conducted in early March, tracked the proportion of respondents who had forwarded a link in the previous month to: an article about a brand or product (18% in the US); a brand’s or product’s website (16%); and a brand’s or product’s video (11%). In each case, women were more likely to have shared brand-related content than men.

Specifically:
  • 22% of online American women had forwarded a link to an article about a brand, compared to 14% of men;
  • 21% of women had forwarded a link to a brand’s or product’s website, versus 11% of men; and
  • 13% of women had forwarded a link to a brand’s or product’s video, compared to 9% of men.
While one might expect sharing to be highest among the youngest respondents, that was not the case among American respondents. The 35-49 group was most likely to have shared a link to a brand’s or product’s website (20%) or video (14%). 18-34-year-olds and 35-49-year-olds were equally as likely to have forwarded a link to an article (each at 20%).


Some other demographic differences emerged:
  • Those from high-income households were the most likely to have participated in each sharing activity;
  • Married respondents were significantly more likely than non-married respondents to have shared a link to a brand website (19% vs. 12%);
  • The likelihood of having shared a link to a brand’s website or video increased alongside educational level;
  • Business owners were roughly twice as likely to have participated in each activity than non-business owners, while the gap was even larger between senior executives and decision-makers and respondents not in those positions.
Interestingly, American respondents were less likely to share links to brand’s websites and videos than the average respondent across the 24 countries tracked. Demographic variances also differed on a global level: the gender discrepancies vanished, while a clear age dynamic (higher sharing propensity among younger respondents) emerged.

Respondents in South Africa were the most likely to have shared a link to an article about a brand or product (32%), while those in Japan (2%) were the least likely. When it came to forwarding a link to a brand’s or product’s website, Turkish respondents (35%) topped the list, with the Japanese (3%) again at the bottom. The same two countries appeared at both ends of the spectrum in terms of forwarding links to brand or product videos (28% and 1%, respectively).

About the Data: The data is derived from the Global @dvisor Wave 43 (G@43), an Ipsos survey conducted between March 5th and 19th, 2013.

The survey instrument is conducted monthly in 24 countries around the world via the Ipsos Online Panel system. The countries reporting herein are Argentina, Australia, Belgium, Brazil, Canada, China, France, Great Britain, Germany, Hungary, India, Indonesia, Italy, Japan, Mexico, Poland, Russia, Saudi Arabia, South Africa, South Korea, Spain, Sweden, Turkey and the United States of America.

For the results of the survey presented herein, an international sample of 18,147 adults aged 18-64 in the US and Canada, and age 16-64 in all other countries, were interviewed. Approximately 1000+ individuals participated on a country by country basis via the Ipsos Online Panel with the exception of Argentina, Belgium, Hungary, Indonesia, Mexico, Poland, Russia, Saudi Arabia, South Africa, South Korea, Sweden and Turkey, where each have a sample approximately 500+.

Weighting was then employed to balance demographics and ensure that the sample’s composition reflects that of the adult population according to the most recent country Census data, and to provide results intended to approximate the sample universe.

Take your video marketing to the next level.
Call Jeff at 888-712-8211 today!   


VMakers - Video made easy.
Trusted by Disney, Warner Bros, NBC, Paramount, CBS and ABC.
info@VMakers.com

July 2013 U.S. Online Video Rankings - Over 19 Billion Ad Impressions [comScore]

comScore Video Metrix service released data showing that 187 million Americans watched more than 48 billion online content videos in July, while the number of video ad views totaled 19.6 billion.

Top 10 Video Content Properties by Unique Viewers
Google Sites, driven primarily by video viewing at YouTube.com, ranked as the top online video content property in July with 167.9 million unique viewers (up 6 percent since June), followed by Facebook with 61.3 million, AOL, Inc. with 57.9 million, VEVO with 49.6 million and Microsoft Sites with 49.6 million. More than 48 billion video content views occurred during the month, with Google Sites generating the highest number at nearly 17.7 billion, followed by AOL, Inc. with 793 million and Facebook with 741 million. Google Sites had the highest average engagement among the top ten properties.

Top U.S. Online Video Content Properties Ranked by Unique Video Viewers
July 2013 Total U.S. – Home and Work Locations
Content Videos Only (Ad Videos Not Included)
Property Total Unique Viewers (000) Videos (000)* Minutes per Viewer
Total Internet : Total Audience  187,430 48,466,326 1,353.8
Google Sites 167,894 17,717,106 544.0
Facebook 61,320 741,336 21.6
AOL, Inc. 57,857 792,719 50.1
VEVO 49,635 613,794 42.1
Microsoft Sites 49,610 668,442 34.0
NDN 49,142 560,024 92.3
Yahoo! Sites 42,043 324,436 76.7
Viacom Digital 39,721 446,401 48.1
Amazon Sites 37,990 146,291 26.0
Turner Digital 30,627 254,803 38.5
*A video is defined as any streamed segment of audiovisual content, including both progressive downloads and live streams. For long-form, segmented content, (e.g. television episodes with ad pods in the middle) each segment of the content is counted as a distinct video stream. Video views are inclusive of both user-initiated and auto-played videos that are viewed for longer than 3 seconds.

Top 10 Video Ad Properties by Video Ads Viewed
Americans viewed 19.6 billion video ads in July, with Google Sites ranking #1 with 3.4 billion ad impressions. BrightRoll Platform came in second with 2.1 billion ads, followed by Adap.tv with 2.1 billion, LiveRail.com with 1.8 billion and Specific Media with 1.4 billion. Time spent watching video ads totaled 7.4 billion minutes, with BrightRoll Platform and Adap.tv delivering the highest duration of video ads at 1 billion minutes each. Video ads reached 55 percent of the total U.S. population an average of 114 times during the month. Hulu delivered the highest frequency of video ads to its viewers with an average of 69.

Top U.S. Online Video Ad Properties Ranked by Video Ads* Viewed
July 2013 Total U.S. – Home and Work Locations
Ad Videos Only (Content Videos Not Included)
Property Video Ads (000) Total Ad Minutes (MM) Frequency (Ads per Viewer) % Reach Total U.S. Population
Total Internet : Total Audience  19,600,333 7,428 114.3 55.4
Google Sites 3,395,788 319 29.8 36.8
BrightRoll Platform**† 2,115,799 1,032 12.8 53.6
ADAP.TV† 2,092,012 1,012 17.0 39.7
LIVERAIL.COM† 1,827,670 618 25.7 23.0
Specific Media** 1,395,294 537 13.4 33.6
TubeMogul Video Ad Platform† 1,280,360 393 14.6 28.4
Hulu 1,161,485 447 69.2 5.4
Tremor Video** 751,397 364 11.5 21.0
NDN 725,758 199 16.1 14.6
Videology† 624,326 230 9.0 22.4
*Video ads include streaming-video advertising only and do not include other types of video monetization, such as overlays, branded players, matching banner ads, etc.
**Indicates video ad network
†Indicates video ad exchange/DSP/SSP

Top 10 YouTube Partner Channels by Unique Viewers
The July 2013 YouTube partner data revealed that video music channel VEVO maintained the top position in the ranking with 47.6 million viewers. Fullscreen held on to the #2 position with 34.5 million viewers, followed by Maker Studios Inc. with 28.6 million, Warner Music with 27.6 million and ZEFR (formerly MovieClips) with 26.5 million. Among the top 10 YouTube partners, Machinima demonstrated the highest engagement (76 minutes per viewer), followed by Maker Studios Inc. (92 minutes per viewer). VEVO streamed the greatest number of videos (582 million), followed by Maker Studios Inc. (531 million).

Top YouTube Partner Channels* Ranked by Unique Video Viewers
July 2013 Total U.S. – Home and Work Locations
Content Videos Only (Ad Videos Not Included)
Property Total Unique Viewers (000) Videos (000) Minutes per Viewer
VEVO @ YouTube 47,635 581,895 40.6
Fullscreen @ YouTube 34,465 353,275 32.7
Maker Studios Inc. @ YouTube 28,594 530,738 69.6
Warner Music @ YouTube 27,648 164,463 19.1
ZEFR @ YouTube 26,473 136,972 14.3
The Orchard @ YouTube 22,129 86,843 11.4
Machinima @ YouTube 18,177 417,479 91.8
UMG @ YouTube 16,948 56,890 9.6
BroadbandTV @ YouTube 16,033 136,400 28.1
SonyBMG @ YouTube 13,987 39,669 8.3

Other findings from July 2013 include:
  • 86.6 percent of the U.S. Internet audience viewed online video.
  • The duration of the average online content video was 5.2 minutes, while the average online video ad was 0.4 minutes.
  • Video ads accounted for 28.8 percent of all videos viewed and 2.8 percent of all minutes spent viewing video online.
Take your video marketing to the next level.
Call Jeff at 888-712-8211 today!   


VMakers - Video made easy.
Trusted by Disney, Warner Bros, NBC, Paramount, CBS and ABC.
info@VMakers.com

Tuesday, August 20, 2013

Online Video Ads Reached More Americans in July [report]


comScore-Online-Video-Ad-Views-July2013

Despite the slowdown in ad views in July, they still totaled more than double the number from January (9.1 billion), underscoring just how quickly impressions have grown this year.

comScore-Reach-Frequency-Online-Video-Ads-Jan-Jul-2013-Aug2013

Interestingly, online video ad reach took a step forward in July, increasing to 55.4% of the US population from 53.6% in June. The slight decline in total online video ad views was entirely the result of a drop-off in ad frequency, with the average viewer seeing 114 ads during the month, compared to 121 in June.

Google remained the top online video ad property in July, serving almost 3.4 billion ads. BrightRoll moved into the second position (2.1 billion), followed by ADAP.TV (2.1 billion) and LiVERAIL (1.8 billion). It will be interesting to see how Facebook measures up with its video ads: it certainly has extensive reach.

For the month of July, Facebook was the second-largest online video content property by total unique viewers, boasting 61.3 million, according to comScore’s figures, relatively unchanged from June.

Google Sites again had the highest number of unique viewers (167.9 million), with AOL (#3; 57.9 million), VEVO (#4; 49.6 million), and Microsoft Sites (#5; 49.6 million) rounding out the top 5.

Overall, comScore’s data indicates that 86.6% of online Americans watched video content in July, with the total number of videos viewed climbing to 48.5 billion from 44 billion in June. The duration
of the average content video was 5.2 minutes, with the average online video ad lasting 24 seconds.


Other Findings:

  • Among the top 10 video content properties, Google Sites generated the highest engagement, at an average of 544 minutes per viewer during the month. NDN was next at 92.3 minutes per viewer.
  • The average online video viewer spent about 22.6 hours watching video content during the month.
  • VEVO retained its top spot in the YouTube partner rankings, followed by FullScreen and Maker Studios.

No Time? No Resources? Not Sure Where to Start?
Call Jeff at 888-712-8211 today!   


VMakers - Video made easy.
Trusted by Disney, Warner Bros, NBC, Paramount, CBS and ABC.
info@VMakers.com

Monday, August 19, 2013

US Online Video Ad Impressions By Age [study]

US online video ad impressions by age
Viewers aged 55-64 (17%) and 65+ (11%) accounted for a combined 28% of US online video ad impressions in Q2, according to a Videology report on platform activity. That rivals the share of impressions (27%) represented by the 18-34 age group. Interestingly, the older age groups appeared most likely to click on video ads, with index scores of 100.8 (for the 55-64 group) and 103.9 (for the 65 and up crowd).

Index scores are relative to entire combined impressions. The 18-24 age group was least likely to click, with an index reading of 98.2, though that demonstrates that there was little variation between age groups.

(The data is limited to Videology’s platform, and may not be representative of the entire online video viewing population.)

Other completion and click-through rate breakdowns:
  • View completion rate was highest on a relative basis for government ads and lowest for B2B ads;
  • B2B ads enjoyed the highest click-through rates, though, with CPG ads faring the worst of the 12 industries tracked on this measure; and
  • View completion rates were significantly lower for 30 second ads than for 15 second ads, though click-through rates were slightly higher for the former.
In other results, entertainment websites hosted the lion’s share of impressions (55%), with gaming (11%) and news and information (9%) sites next. The most active advertising vertical was CPG, which accounted for 35% of total impressions, followed by auto (13%), restaurants (9%) and retail (9%).

Video advertisers are becoming more sophisticated in their targeting, according to the researchers, with a 14% increase in the share of advanced ads quarter-over-quarter. Behavioral targeting was most common during the quarter (49%), followed by geo-targeting (34%) and day-part (17%).

Total online video ads served increased by 40% quarter-over-quarter, a result which tracks with recent data from comScore demonstrating an ever-increasing volume of online video ad impressions. Mobile ad impressions increased by 73% quarter-over-quarter, but remained just 3% share of total impressions.-MarketingCharts

No Time? No Resources? Not Sure Where to Start?
Call Jeff at 888-712-8211 today!   


VMakers - Video made easy.
Trusted by Disney, Warner Bros, NBC, Paramount, CBS and ABC.
info@VMakers.com

Monday, August 12, 2013

8 Tips to Make The Most of Video on Mobile

As newspaper penetration falls... the culture itself moves from textual to visual literacy.

It’s no surprise that advances in technology have eliminated (nearly) all barriers and allowed, practically anyone, to capture, store, edit and transmit video clips from multiple devices to each and everyone.

The combination of lowered production costs with the rise and availability of multiple platforms and channels, makes it clear that video is ripe with possibilities.

Video is ripe with possibilities - Dominic Byrne

These days getting noticed is difficult amongst all the highly competitive marketing campaigns and first impressions are critical for success. 

A brief summary from a presentation viewed last week by John Speers, DDI:
There is simply no better way to improve your communication or content than to embrace the power of the visual. The brain deciphers images simultaneously, while language is decoded in a linear, sequential manner. Content must be highly visual based, quality visuals that are borne out of strategic integrity, executed brilliantly and imbued with the brand’s values. 
The same presentation references some supporting numbers from WARC, 2013:
  • Marketers using video in email campaigns generate 40% higher revenue, 55% higher click throughs, 44% greater time engaged and a 41% increase in forwarding.
  • 25% of global internet traffic by 2014 will be mobile.
  • “Rich media is the key to engaging, immersive brand experiences with significantly more positive opinion to interactive ads, permitting a deeper brand-to- consumer conversation, which leads to a longer dwell time, 31% more.” (InMobi).
All the stats floating around the internet about video are on graphs that point north, particularly combined with the penetration of mobile.

Dominic-Byrne-Video-and-mobile-is-increasing-DigiToro

With video consumption on mobile going through the roof, by tomorrow it will be too late as video advertising across all platforms becomes the norm and your audience suffers complete saturation, so get on it now and capitalize on early mover advantage.

8 tips to remember:
• Be timely

• Narrow your target
• Use whatever CRM data matching is possible
• Be relevant
• Put the creative in context
• O
ffer an immersive and engaging experience,
• Measure against your business objectives

• Use analytics and insights in each campaign to evaluate and direct your next steps.

The one caveat: video at a commercial level costs money, and quality production takes time.

Check out all the new ad formats including pre-roll, multi-selector pre-roll, interactive, click to rich, overlays, interstitial, calls-to-action, choose your own adventure and social sharing buttons to ensure you drive post-play interaction.

Start targeting and promoting specific messages based on segmentation, personalization and localization. Use video and mobile as a key ingredient to building your brand.-eConsultancy

No Time? No Resources? Not Sure Where to Start?
Call Jeff at 888-712-8211 today!   


VMakers - Video made easy.
Trusted by Disney, Warner Bros, NBC, Paramount, CBS and ABC.
info@VMakers.com

Thursday, August 8, 2013

Online Video Growth Is Massive, Thanks To Social Media


Television is no longer the only game in town for distributing and watching video. The Internet and the social web have provided content creators and advertisers with a cost-effective way to distribute video.
"Social" video  is video that is influenced — in any part of the pipeline, from production to distribution — by social media. For audiences, discovery is no longer about flipping through channels or a TV guide, it's about listening to friends' recommendations and glancing at social media feeds.

In a new report from BI Intelligence, we look at the general state of social video, examine social video audiences and their demographics, analyze how marketers and advertisers are getting into the mix, compare the major social video platforms, and detail how social is influencing video as a content medium.
Here's an overview of the rise of social video:
The report:
-BusinessInsider

No Time? No Resources? Not Sure Where to Start?

Call Jeff at 888-712-8211 today!   


VMakers - Video made easy.
Trusted by Disney, Warner Bros, NBC, Paramount, CBS and ABC.
info@VMakers.com

Monday, August 5, 2013

New YouTube Video Insights - August 2013

YouTube Video Insights
Check out the new quarterly report from YouTube Insights. Get the latest statistics, trends and insights on online video from across YouTube and Google. Stay up to date with how video can help you engage your audiences and achieve business impact.

YouTube Video Insights from Google

Take your video marketing to the next level.
Call Jeff at 888-712-8211 today!   


VMakers - Video made easy.
Trusted by Disney, Warner Bros, NBC, Paramount, CBS and ABC.
info@VMakers.com

Boredom Spurs Video Sharing Among Smartphone Owners

Boredom is a motivator of smartphone use in various countries around the world, details Initiative  in a new study. The survey, undertaken across 13 markets with a range of smartphone penetration rates, finds that 34% of respondents overall watch video while passing the time, with 82% of those (28% overall) uploading or sharing video while passing the time. Propensity to engage in this behavior has almost doubled since 2010, according to the researchers.

Respondents in the Asia-Pacific are most likely to watch (40%) and share (34%) video out of boredom, with North Americans not far behind (39% and 28%, respectively).

Video aside, 40% of the respondents globally said they use social networks, games, or text/IM when they’re bored.

Studies have shown that most smartphone use actually takes place in the home rather than on the go, and the Initiative research reveals that many smartphone owners engage in activities while relaxing at home, suggesting that smartphones can be used as lean-back devices. For example, common smartphone uses while relaxing at home include shopping (52%), texting (51%), watching (50%) and sharing (47%) videos, and using social networks (50%).

About the Data: The survey, conducted in March, covered a total of 13,000 smartphone users aged 18-54 in US, Canada, Brazil, UK, Sweden, France, Germany, Italy, Russia, India, China, South Korea and Australia. The countries were selected to represent markets at different stages of development in terms of mobile activity to provide a truly global view.

Take your video marketing to the next level.
Call Jeff at 888-712-8211 today!   


VMakers - Video made easy.
Trusted by Disney, Warner Bros, NBC, Paramount, CBS and ABC.
info@VMakers.com

Friday, August 2, 2013

Top 10 Video Ads - July 2013


1. GEICO Hump Day Camel Commercial - Happier than a Camel on Wednesday 1,207,444 Shares
2. Grand Theft Auto V: Official Gameplay Video 509,166 Shares
3. Honda "Hands" 248,653 Shares
4. O2 - Be more dog 161,832 Shares
5. baby&me / the new evian film 141,066 Shares
6. Dumb Ways to Die 125,001 Shares
7. Yasiin Bey (aka Mos Def) force fed under standard Guantánamo Bay procedure
107,531 Shares
8. The Camp Gyno
105,809 Shares
9. Shark Week 2013 - Snuffy the Seal | Sunday Aug 4 9|8c
101,924 Shares
-Unruly

Take Your Video Marketing To The Next Level
Call Jeff at 888-712-8211 today!   


VMakers - Video made easy.
Trusted by Disney, Warner Bros, NBC, Paramount, CBS and ABC.
info@VMakers.com

Quality Content = Online Video Success


If you want evidence that the digital video tidal wave is far from cresting, Instagram saw 5 million uploads in the first 24 hours after it launched its new video functionality.  This sparked a fierce debate around the burning question of whether the optimal video length is six or 15 seconds.

If you are a professional content site, the right answer is neither (or both). In fact, it's not even the right question.

Questions worth asking
- How do I create video that my users will actually engage with?
- How do I leverage my video to create more valuable advertising inventory?

In the TV model, driving video consumption was traditionally about the quality of content, the promotion, and the time slot.

We can argue whether time slot is relevant on TV any longer, but it is certainly not a notion that translates well to the Web.  Promotion is critical, but if the content doesn't speak to your users then no amount of hype will get them to watch it.  

Quality of content is the foundation to video success as we have seen in cases ranging from full-length efforts such as “House Of Cards” from Netflix to short form successes such at Globe10.0 on the Boston Globe’s site. (Boston.com).

Quality isn't just an abstract ideal. The most successful professionally produced video on the Web has a distinctive voice.

Network TV has to speak to large audiences.  Cable TV can cater to niches.  But the Web allows for even more granular targeting, and that's what users expect. If you are a content driven site, users come to you for your editorial voice.

You wouldn't serve them generic text content that they could just as easily find on your competitor's site.  Why would you serve up undifferentiated video?

One of the key benefits of featuring video on your site is that it is highly engaging. Don't squander that opportunity to connect with your user by delivering video content that doesn't reflect your site's basic values.

The Wall Street Journal's upcoming series of documentaries on promising start-ups is another good example of targeted content. It is on brand and contextually relevant.

Creating this kind of original and distinctive video content also sets up publishers to take advantage of the migration of advertising dollars from TV to the Web. With digital video ad spending expected to jump 20% to over $5 billion in 2014, original video is no longer a category to be left to the big portals.

And this doesn't just mean standard pre-roll. That will only get you in the game.  Native advertising has become a hot marketing buzzword.   In order to deliver the contextually relevant experience marketers seek in video, sites must start creating original content that targets their audience while creating an integrated marketing opportunity for advertisers.

The success of social video apps like Vine and Instagram is a great indicator of how much users love to interact with video, but it is just part of a much larger video ecosystem. If your video content reflects who you are, then you can catch the video wave and your business will enjoy a long profitable ride.-MediaPost

No Time? No Resources? Not Sure Where to Start?
Call Jeff at 888-712-8211 today!   


VMakers - Video made easy.
Trusted by Disney, Warner Bros, NBC, Paramount, CBS and ABC.
info@VMakers.com