Interesting facts displayed on this YouTube Infographic from bindarymoon.co.uk.
Get easy and affordable videos for any size business.
Sign Up FREE - VMakers.com
888.712.8211, info@VMakers.com
VMakers.com
The "Hollywood" Studio Pros
The peeps behind your favorite shows and movies, including: Ellen,
Seinfeld, Whitney, How I Met Your Mother, The Disney
Channel and more.
Tuesday, February 28, 2012
Thursday, February 23, 2012
Video Accounts For Half Of All Mobile Traffic
Mobile video now accounts for half of all mobile traffic; and on some
networks, that number is as high as 69 percent — a testament to the
rise of smartphones and tablets as the mobile devices of choice for
consumers, and their growing interest in using these devices to do a lot
more than just make phone calls.
The data, from quarterly report on mobile data usage out today from mobile analytics firm Bytemobile, also found that Android is generating more mobile ad volume than iOS devices, and that Google now accounted for 75 percent of ad-generated data across all platforms.
Bytemobile says it has collected this data from a cross-section of its mobile carrier customers. It focuses on usage of two main platforms, Apple’s iOS and Google’s Android.
As many have already suspected, tablets are driving significantly more data traffic than smartphones. On Apple’s iOS platform, an iPad user generates three times as much traffic as someone using an iPhone; while on Android, the figure is twice as much when comparing Android tablets and handsets.
This is not too surprising: tablets’ bigger screens are that much more conducive to consuming video and other content than the smaller screen of a smartphone; and in the case of something like video, those tablets will require higher resolutions, which also translates to heavier data use.
The most-used application on iOS, for example, is Safari, accounting for 61 percent of all transactions.
Although users spend slightly more time per session on Facebook than they do YouTube — 9.06 versus 8.51 minutes, respectively — YouTube generates, on average, 40 megabytes per session, compared to 120 kilobytes for Facebook or 170kb for Twitter. Twitter’s average session usage is 4.57 minutes.
Android devices appear to be generating more ad impressions and engagement — collectively called “transactions” by Bytemobile. On Android, some 9 percent of all data transactions were ad-related, while on iOS the proportion was 5 percent.
Why is that? It could be down to the fact that Android generally has fewer paid apps in the Market than Apple’s App Store, and those more popular free apps are pulling more ads down from networks when they get used.
As with online, Google dominates the mobile ad space with its owner of AdMob, AdSense and DoubleClick holdings. Together, these accounted for 75 percent of all ad data. But when it comes to the single-most consuming ad network, that dubious honor goes to Apple’s iAd: its video-rich ad units generate nearly 16 MB of data per transaction, while the lowest were AdMob’s display units, which generated less than 4MB. - TechCrunch
Easy and affordable videos for any size business.
Sign Up FREE - VMakers.com
888.712.8211, info@VMakers.com
VMakers.com
The "Hollywood" Studio Pros
The peeps behind your favorite shows and movies, including: Ellen, Seinfeld, Whitney, How I Met Your Mother, The Disney Channel and more.
The data, from quarterly report on mobile data usage out today from mobile analytics firm Bytemobile, also found that Android is generating more mobile ad volume than iOS devices, and that Google now accounted for 75 percent of ad-generated data across all platforms.
Bytemobile says it has collected this data from a cross-section of its mobile carrier customers. It focuses on usage of two main platforms, Apple’s iOS and Google’s Android.
As many have already suspected, tablets are driving significantly more data traffic than smartphones. On Apple’s iOS platform, an iPad user generates three times as much traffic as someone using an iPhone; while on Android, the figure is twice as much when comparing Android tablets and handsets.
This is not too surprising: tablets’ bigger screens are that much more conducive to consuming video and other content than the smaller screen of a smartphone; and in the case of something like video, those tablets will require higher resolutions, which also translates to heavier data use.
The most-used application on iOS, for example, is Safari, accounting for 61 percent of all transactions.
Although users spend slightly more time per session on Facebook than they do YouTube — 9.06 versus 8.51 minutes, respectively — YouTube generates, on average, 40 megabytes per session, compared to 120 kilobytes for Facebook or 170kb for Twitter. Twitter’s average session usage is 4.57 minutes.
Android devices appear to be generating more ad impressions and engagement — collectively called “transactions” by Bytemobile. On Android, some 9 percent of all data transactions were ad-related, while on iOS the proportion was 5 percent.
Why is that? It could be down to the fact that Android generally has fewer paid apps in the Market than Apple’s App Store, and those more popular free apps are pulling more ads down from networks when they get used.
As with online, Google dominates the mobile ad space with its owner of AdMob, AdSense and DoubleClick holdings. Together, these accounted for 75 percent of all ad data. But when it comes to the single-most consuming ad network, that dubious honor goes to Apple’s iAd: its video-rich ad units generate nearly 16 MB of data per transaction, while the lowest were AdMob’s display units, which generated less than 4MB. - TechCrunch
Easy and affordable videos for any size business.
Sign Up FREE - VMakers.com
888.712.8211, info@VMakers.com
VMakers.com
The "Hollywood" Studio Pros
The peeps behind your favorite shows and movies, including: Ellen, Seinfeld, Whitney, How I Met Your Mother, The Disney Channel and more.
Thursday, February 16, 2012
7 Online Video Marketing Tips
People today demand engaging and interactive content. They expect that content to be highly functional, highly intuitive and highly intelligent. Video delivers all of that. Cheaper than TV, but with editorial and production values just as high. It's an innovative and non-intrusive way of marketing.
Video delivers extraordinary economies of scale
and measurable results.
You can reach more people with more engaging communications 24/7. Produced and distributed effectively, video will increase revenue and decrease costs.
7 online video tips to boost your marketing efforts:
1. Post quality video content on your websites.
2. Upload video content to YouTube to enhance search engine visibility.
3. Build communities with contests and user generated content.
4. Broadcast sales and marketing events — live and on-demand,
5. Educate and train employees, distributors and end-users with demonstrations.
6. Promote your products and services with digital signage.
7. Enable sharing via social networks: Facebook, Twitter, LinkedIn, and YouTube.
Traditional sales and marketing approaches are less and less effective. Video marketing offers new ways to connect via search, social media, viral marketing campaigns, and live events.
Gain a competitive edge with video created by VMakers.com
VMakers - Video without the hassles, guesswork and high costs.
Sign Up FREE - VMakers.com
888.712.8211, info@VMakers.com
VMakers.com
The "Hollywood" Studio Pros
The peeps behind your favorite shows and movies, including: Ellen, Seinfeld, Whitney, How I Met Your Mother, The Disney Channel and more.
Wednesday, February 15, 2012
Video Plays On Tablets, Mobile Devices & Connected TVs Nearly Doubled in Q4
Offering consumers video content where and when they want it is no
longer just a second thought. Serving content across platforms has
become essential for publishers and brands that want to grow their
audiences and earn more revenue with online video.
Ooyala, the online video provider, today released its fourth quarter review of web video, in which it analyzes the viewing behavior of 100 million monthly unique users.
As we learned in Q3, the rabid adoption of mobile devices has been leading to increased engagement with online video. Not only that, but connected TVs are really beginning to make waves, Google TV in particular. Ooyala’s report found that video plays on tablets, mobile devices, and connected TVs nearly doubled in the fourth quarter (from Q3).
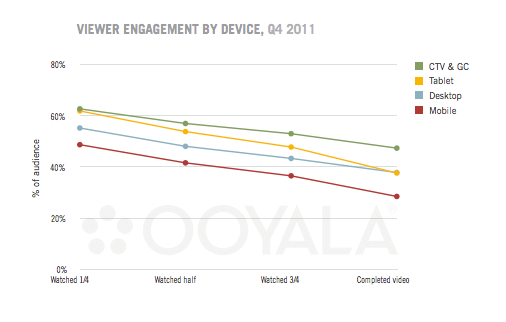
What’s more, viewers are now twice as likely to complete a video when watching on a tablet or connected TV, as compared to watching video on a desktop. And, unsurprisingly, when viewers plop down on their couch in front of their connected TV, they’re watching four times as many long videos compared to short videos, as videos longer than 10 minutes now account for more than half the hours played on connected TVs.

While the average conversion rate across all devices increased from 35.1 percent in Q3 to 39.6 percent in Q4 (with viewers watching longer on all platforms), it seems that connected TVs saw the biggest growth in Q4, as their viewers proved to be the most engaged of all the platforms, completing videos at a rate of 47 percent (with tablet viewers following close behind at 38 percent.)
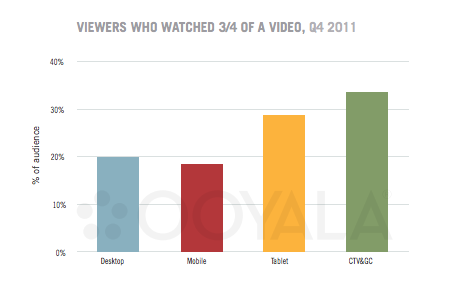
Users of connected TV devices and gaming consoles were 70 percent more likely to watch three-quarters of a video. And, in terms of name brands in connected TVs, Google TV’s share of video plays increased by 91 percent this quarter.
Tablet viewers were the most engaged in Q3, and they certainly remained an attentive audience in Q4, proving to be 45 percent more likely to complete three-quarters of a video than those watching on a desktop. Not only that, but tablet viewers watched 21.9 percent longer per video in Q4 than the prior quarter.
Another interesting tidbit from Ooyala: Facebook remains a much more active source of online video sharing than Twitter: For every video shared via Twitter in Q4, more than 10 were shared on Facebook. - Rip Empson, TechCrunch

Easy and affordable videos for any size business.
Sign Up FREE - VMakers.com
Ooyala, the online video provider, today released its fourth quarter review of web video, in which it analyzes the viewing behavior of 100 million monthly unique users.
As we learned in Q3, the rabid adoption of mobile devices has been leading to increased engagement with online video. Not only that, but connected TVs are really beginning to make waves, Google TV in particular. Ooyala’s report found that video plays on tablets, mobile devices, and connected TVs nearly doubled in the fourth quarter (from Q3).
What’s more, viewers are now twice as likely to complete a video when watching on a tablet or connected TV, as compared to watching video on a desktop. And, unsurprisingly, when viewers plop down on their couch in front of their connected TV, they’re watching four times as many long videos compared to short videos, as videos longer than 10 minutes now account for more than half the hours played on connected TVs.

While the average conversion rate across all devices increased from 35.1 percent in Q3 to 39.6 percent in Q4 (with viewers watching longer on all platforms), it seems that connected TVs saw the biggest growth in Q4, as their viewers proved to be the most engaged of all the platforms, completing videos at a rate of 47 percent (with tablet viewers following close behind at 38 percent.)
Users of connected TV devices and gaming consoles were 70 percent more likely to watch three-quarters of a video. And, in terms of name brands in connected TVs, Google TV’s share of video plays increased by 91 percent this quarter.
Tablet viewers were the most engaged in Q3, and they certainly remained an attentive audience in Q4, proving to be 45 percent more likely to complete three-quarters of a video than those watching on a desktop. Not only that, but tablet viewers watched 21.9 percent longer per video in Q4 than the prior quarter.
Another interesting tidbit from Ooyala: Facebook remains a much more active source of online video sharing than Twitter: For every video shared via Twitter in Q4, more than 10 were shared on Facebook. - Rip Empson, TechCrunch

Easy and affordable videos for any size business.
Sign Up FREE - VMakers.com
888.712.8211, info@VMakers.com
VMakers.com
The "Hollywood" Studio Pros
The peeps behind your favorite shows and movies, including: Ellen, Seinfeld, Whitney, How I Met Your Mother, The Disney Channel and more.
VMakers.com
The "Hollywood" Studio Pros
The peeps behind your favorite shows and movies, including: Ellen, Seinfeld, Whitney, How I Met Your Mother, The Disney Channel and more.
Social Recommendations Increase Online Video Ad Performance
![]() |
According to the Social Ad Effectiveness study by Unruly, the results of a survey to determine the impact of recommendation on brand metrics among 18-34 year olds found that social recommendations dramatically increased ad performance.
• Video enjoyment increased purchase intent by 97% and brand association by 139%
• Enjoyment of the video rose by 14% among viewers who had viewed following a recommendation
• Brand recall and brand association rose 7% among viewers who had been recommended the video versus viewers who found it by browsing.
• Video enjoyment increased purchase intent by 97% and brand association by 139%
• Enjoyment of the video rose by 14% among viewers who had viewed following a recommendation
• Brand recall and brand association rose 7% among viewers who had been recommended the video versus viewers who found it by browsing.
The explosion of social networking has opened up a massive opportunity for advertisers to open a dialogue with their audiences, particularly via video campaigns that make brand ambassadors of opinion leaders in social spaces. Social video advertising has grown rapidly, more than doubling in size every year since 2009.
However, there is little granularity around the extent to which social advertising impacts traditional brand metrics. This study sets out to understand the effect of recommendations in online video advertising, determining to what extent social recommendations affect brand metrics such as recall, favorability, message association and purchase intent. It finds that recommendations impact video enjoyment, and so also considers the effect of video enjoyment on the key brand metrics.
Key findings:
14% increase in the number of people who enjoyed the video following a recommendation versus those who had discovered it by browsing. Moreover, a recommendation reduced the number of people who did not enjoy the video by 41%.
Viewer enjoyment of branded video is important because it has a direct
impact on key brand metrics. Viewers who enjoyed the video they watched
demonstrated 139% higher brand association, 97% higher purchase intent,
higher brand favorability, and higher brand recall than their
counterparts who did not enjoy the video.


Recommendations caused a 7% increase in brand association. Agreement with key brand statements increased from 41% among viewers who had browsed to the video to 44% among viewers who seen the video following a recommendation.
Recommendations make viewers more receptive to brand messaging. Recommendations have a large role to play for brands, says the report, in changing off-message perceptions among their audiences as well as in actively cultivating on-message perceptions.
49% of viewers purchased the
advertised product within three days of the view. 38% of viewers spoke
to someone in person about the video, showing a social video view to
stimulate real life conversation. 9% of users searched for the brand,
and 4% of users searched for products of that type. Social video viewing
is having an effect across all aspects of the purchase funnel.
The power of social video lies in the recommendation to view content. This recommendation comes from peers in social media environments, and from authoritative blogs and news sources covering advertiser content editorially. The impact of the recommendation on consumers is considerable:
• Viewers are more likely to enjoy a video when it has been recommended than when encountered through browsing (14% higher enjoyment)
• Viewers are more likely to recall a brand name when the social video has been recommended than when encountered through browsing (7% higher recall)
• Viewers are more likely to engage with an ad’s messages when the social has been recommended than when encountered through browsing (10% higher brand association)
-Center For Media Research
Easy and affordable videos for any size business.
Sign Up FREE - VMakers.com
• Viewers are more likely to enjoy a video when it has been recommended than when encountered through browsing (14% higher enjoyment)
• Viewers are more likely to recall a brand name when the social video has been recommended than when encountered through browsing (7% higher recall)
• Viewers are more likely to engage with an ad’s messages when the social has been recommended than when encountered through browsing (10% higher brand association)
-Center For Media Research
Easy and affordable videos for any size business.
Sign Up FREE - VMakers.com
888.712.8211, info@VMakers.com
VMakers.com
The "Hollywood" Studio Pros
The peeps behind your favorite shows and movies, including: Ellen, Seinfeld, Whitney, How I Met Your Mother, The Disney Channel and more.
VMakers.com
The "Hollywood" Studio Pros
The peeps behind your favorite shows and movies, including: Ellen, Seinfeld, Whitney, How I Met Your Mother, The Disney Channel and more.
Monday, February 6, 2012
Digital Video Ad Spending to Explode by Over 250%
Consumer packaged goods (CPG) and health brands spend more on video advertising.
Throughout 2011, CPG brands spent more than any other group on video advertising -- making up 24% of all dollars spent, according to new data from YuMe. Health and pharmaceutical brands came in second -- with a 16% share of the video ad market-- despite a 400% year-over-year increase in spending.
The 25-54 consumers were the most-requested demographic -- making up 15% of RFPs -- the video ad network found. Females 25-54 were the most-requested female demographic in 2011, with 39% of requested RFPs.
Spending on non-gender-specific campaigns made up 66% of ad dollars in 2011 -- up from 55% in 2010 -- while spending on female-targeted campaigns made up 25% of ad dollars.
While still attractive to advertisers, requests for females 25-54 actually decreased slightly from 42% in 2010 to 37% in 2011, while requests for males 25-54 held steady year-over-year at 22%.
Marketers should note that consumers ages 12-24 experienced the highest average video completion rate at 73%, although they had less spending power.
According to a recent estimate by Forrester, domestic digital video ad spending will explode by over 250%, from $2 billion in 2011 to $5.4 billion by 2016. The forecast was largely attributed to a renaissance in quality, brand-safe video content, a proliferation in video-friendly devices and the maturing of younger, online adept consumers.
Separately, although still in its infancy, the Connected TV market made up over 1% of impressions served during the fourth quarter of the year, while mobile impressions nearly doubled quarter-over-quarter to 5% of video ads served. But the dominant video advertising unit, pre-roll’s market share, continued to decline in 2011 from 93% in 2010 to 89% of ads served.
Per Forrester, 37 million U.S. households currently own a connected device that enables them to watch digital video on their TV screen -- up from fewer than 25 million in 2010. Among these connected households, younger consumers lead the way, outpacing the overall population in adoption by nearly 20 percentage points.
Forrester projects that connected device penetration will reach 50% in 2016, further opening the fragmentation floodgates of video consumption options.
In another finding, the majority of ad impressions that YuMe served in 2011 were in California at 11.0% of total volume, followed by New York at 7.9% and Texas at 6.8%.
YuMe bases its analysis on average video completion rates, regardless of pre-roll length. Targeted audience demographics are based on the audience targeted by the advertiser, as stated in applicable request for proposals. - Gavin O'Malley, MediaPost
Easy and affordable videos.
Get started today! Call VMakers - 888.712.8211, info@VMakers.com
VMakers.com
The "Hollywood" Studio Pros
The team behind your favorite shows and movies, including: Ellen, Seinfeld, Whitney, How I Met Your Mother, Chelsea Handler, The Disney Channel and more.
Throughout 2011, CPG brands spent more than any other group on video advertising -- making up 24% of all dollars spent, according to new data from YuMe. Health and pharmaceutical brands came in second -- with a 16% share of the video ad market-- despite a 400% year-over-year increase in spending.
The 25-54 consumers were the most-requested demographic -- making up 15% of RFPs -- the video ad network found. Females 25-54 were the most-requested female demographic in 2011, with 39% of requested RFPs.
Spending on non-gender-specific campaigns made up 66% of ad dollars in 2011 -- up from 55% in 2010 -- while spending on female-targeted campaigns made up 25% of ad dollars.
While still attractive to advertisers, requests for females 25-54 actually decreased slightly from 42% in 2010 to 37% in 2011, while requests for males 25-54 held steady year-over-year at 22%.
Marketers should note that consumers ages 12-24 experienced the highest average video completion rate at 73%, although they had less spending power.
According to a recent estimate by Forrester, domestic digital video ad spending will explode by over 250%, from $2 billion in 2011 to $5.4 billion by 2016. The forecast was largely attributed to a renaissance in quality, brand-safe video content, a proliferation in video-friendly devices and the maturing of younger, online adept consumers.
Separately, although still in its infancy, the Connected TV market made up over 1% of impressions served during the fourth quarter of the year, while mobile impressions nearly doubled quarter-over-quarter to 5% of video ads served. But the dominant video advertising unit, pre-roll’s market share, continued to decline in 2011 from 93% in 2010 to 89% of ads served.
Per Forrester, 37 million U.S. households currently own a connected device that enables them to watch digital video on their TV screen -- up from fewer than 25 million in 2010. Among these connected households, younger consumers lead the way, outpacing the overall population in adoption by nearly 20 percentage points.
Forrester projects that connected device penetration will reach 50% in 2016, further opening the fragmentation floodgates of video consumption options.
In another finding, the majority of ad impressions that YuMe served in 2011 were in California at 11.0% of total volume, followed by New York at 7.9% and Texas at 6.8%.
YuMe bases its analysis on average video completion rates, regardless of pre-roll length. Targeted audience demographics are based on the audience targeted by the advertiser, as stated in applicable request for proposals. - Gavin O'Malley, MediaPost
Easy and affordable videos.
Get started today! Call VMakers - 888.712.8211, info@VMakers.com
VMakers.com
The "Hollywood" Studio Pros
The team behind your favorite shows and movies, including: Ellen, Seinfeld, Whitney, How I Met Your Mother, Chelsea Handler, The Disney Channel and more.
Wednesday, January 18, 2012
Social Video Predictions - 2012
There is no doubt that 2011 has been a record-breaking year for social video.
So what does 2012 hold for online video?
Here are some predictions from Unruly Media's 'What's next for social video?' insight report...
The US Election and the Olympics will be meme playgrounds, and memes are also likely to spring from End of the World predictions as December 21 approaches: it’s the end of a 5,125-year-long cycle in the Mesoamerican Long Count calendar which has been the centre of speculation in certain circles.
Brands will be anticipating the memes, themes and Olympian dreams of 2012, creating video content around key events, and epic ads that use storytelling to engage and build long-term connections with audiences, as with the Heineken content of 2011.
People will be creating and watching more user/community-funded films in 2012, with companies like Kickstarter providing independent film makers with access to funding, and video tools from YouTube and others boosting the quality of user generated content.
Brands will do more to encourage audience participation and interaction both by using their audiences to create content via competitions, and by introducing interactive functionality alongside their video content.
Alongside epic, high quality content, fast/sticky/funny content will persist in video, and extend via GIFs.
Video and images are the key components of meme propagation online and simple GIFs are likely to become fancier and spread more readily as a midpoint between video and images.
GIFs behave as video shorthand and will become a more common form of expression in 2012 thanks to free downloadable and web-based programmes for GIF creation and opportunities to post GIFs on Tumblr, Google+ and new GIF sites.
Mobile is the fastest growing information & communications technology ever seen (Figure 1) and mobile penetration will continue to grow in 2012.
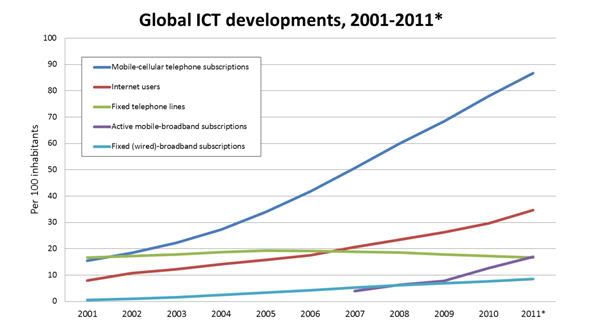
Figure 1
Source: ITU World Telecommunication / ICT Indicators database. *2011 data is estimated.
A ‘best available device’ culture will emerge, which sees users demanding the content they want, when they want it, on the best screen they happen to have to hand at that moment.
This is already happening, and providers of content by subscription, from the Financial Times to AppleTV are selling cross-platform subscriptions to allow content to be pulled from the cloud onto multiple devices.
This culture is likely to lead to the introduction of a ‘Continuous Client’, a term coined by Joshua Topolsky of Engadget in 2010, which describes full synchronicity between multiple devices so that the work done on a phone, tablet or PC follows a user around as they switch to other devices.
As Topolsky says: "your devices (and their clients) should talk to each other so that you can placeshift your session from screen to screen".
Figure 2 shows that ad campaigns that have been run across two platforms perform better than those that have been run across a single platform: with data like this and users consuming media across multiple devices, brands will increase their cross platform ad spends significantly in 2012.
As brand budgets follow the audiences to mobile, blending of brand video delivery across online, mobile and TV platforms will become commonplace.
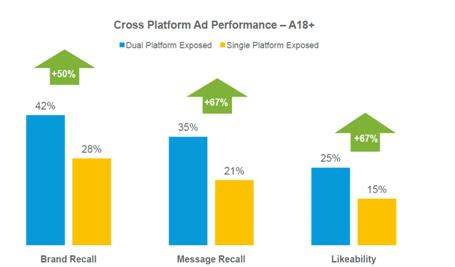
Figure 2
Nielsen Cross Platform Behaviour, September 2011
Brands will also start embracing multi-screen consumption, engaging with the companion screen to create content which is designed to complement a TV-type viewing experience.
Users are already using the companion screen while watching TV, and in 2012 more brands, particularly broadcasters, will come out with companion content designed for smartphones and tablets.
Now that smartphones increasingly have 3D and Augmented Reality (AR) delivery capabilities built in, there will be a jump in the amount of commercially produced 3D and AR content in 2012, especially as 3DTV proliferation increases.
Entertainment and top FMCG brands are likely to lead this charge. Juniper Research predicts that AR mobile revenues will jump from $2m in 2010 to $1.5bn in 2015.
As new smartphones and tablets hit the market with increasingly diverse features, from advanced camera technologies to temperature sensors and barometers, new features are likely to become a springboard for innovations from native application developers.
Developing and supporting native applications for multiple devices and operating systems is time consuming and expensive. Brands have a need for quality HTML5 functionality which allows them to support features cross platform.

Figure 3
Source: ITU World Telecommunication / ICT indicators database. Developed / developing country classifications are based on the UN M49. *2011 data is estimated.
Figure 3 shows that emerging markets are seeing a much faster and wider adoption of mobile devices than of internet connected desktop and laptop devices, and that increasing mobile subscriptions are impacting the growth of web use(slightly but significantly) in those markets.
These trends result from the ability to access connectivity at a much lower cost via mobile devices. For example, Aakash, a tablet device launched in India, is being sold to students at the subsidised price of $35, and are likely to continue in emerging economies over the coming years.
Affordable mobile technology is becoming a work platform and a revenue generator for people in emerging economies.
For global advertisers, this means new markets are opening up: direct-to-consumer channels are becoming available in territories previously difficult to reach, such as India and Africa.
India’s current internet penetration stands at 6.6% of the population but is predicted to reach 29.5%, with the number of Indian smartphones set to top 450, by 2015 .
The advent of social video viewing platforms like Shelby.tv and VHX may begin to change the way people discover, consume and share social video content.
These platforms are designed to turn Twitter, Facebook and Tumblr into TV channels, where you can discover and watch all of the videos your friends are sharing and talking about in real time.
They facilitate a dedicated social video experience, and may be more widely used in 2012.
Facebook
Facebook is already becoming a gatekeeper, having introduced an Advertiser Whitelist, Facebook Credits, and HTTPS support requirements in 2011, and they will continue to control third party access, introducing more third party requirements in 2012 and beyond.
On Facebook for the mobile web or iPad, if you tap on a story that a friend has posted in your newsfeed relating to an app, Facebook will fast-app-switch you over to the app if you already have it, or it will deep link you to the app store to download the app if not.
This functionality tries to be device-appropriate: if you’re viewing from an Android device, it will direct you to the Android app if possible.
HTML5 apps are not mainstream, so it’s essential for Facebook to fully support native applications. However, the current solution takes users out of the site and out of Facebook’s control, so it is unlikely to be a long term fix.
The leaked Project Spartan, a Facebook developer platform designed for mobile apps in HTML5, may be released in 2012 as a longer term play from the company as HTML5 becomes more developed and functional.
Twitter
Twitter will do more with 'Big Data' in 2012. It introduced link shortening in June 2011, meaning that it can now wrap all links shared in Twitter in the ‘t.co’ format to capture data around how popular links are.
Twitter owns a lot of data around the number of clicks in a given time period, and may use this real-time link tracking to introduce real-time targeted ads.
The trend towards live content and on-demand services on YouTube will continue as Connected TV and TV on Demand blur the lines between TV and online.
Also, there are likely to be more pay-per-view partnerships between YouTube and broadcasters. For example, the Ultimate Fighting Championship made all of the main card fights from UFC 135 available live for fans in the U.S. on the UFC YouTube channel for $44.99.
Hangouts have the potential to become a hub for real-time socialised co-viewing, perhaps particularly around video classes, and Google+ may increase focus on social viewing via hangouts in 2012.
A little later, with the rise of Facebook games, the average social gamer was a 43-year-old woman, and by 2011, the largest demographic was 25-34 males, with females not far behind (Figure 4).
By 2012, there will be 68.7m social gamers in the US, and already 92% of smartphone owners play mobile games weekly.
Within social gaming, value exchange advertising will be huge. Value exchange allows brands to reward users for engaging with their content, presenting a positive experience for users at the time that they choose to interact, and freeing them from annoying ‘ads’ during gameplay.
Engaging with users when they are gaming allows advertisers to reach users in their downtime when they have time to engage with content: sharing it, clicking through for more information and commenting on it if they find it interesting.

Figure 4 Figure 5
Popcap Research, September 2011, Mashable, March 2011
China’s use of social platforms is increasing and the most popular platforms tend to be homegrown, largely because Facebook, YouTube, Twitter, Google+ and many other platforms are banned in China.
Youku is the top Chinese video sharing site, Sina runs the biggest blog and microblog community, and China’s various social networks are illustrated in Figure 5.
Global brands will have to start tailoring social plans to make use of these international social platforms, in order to have success around the world.
The honeymoon for the 15-second pre-roll ad is coming to an end as advertisers demand better execution and cut-through and move budgets from push formats towards pull solutions; even pre-roll is starting to morph into an interactive multi-choice medium.
The pioneering brands of 2012 will be looking to brands that have created memes (like Old Spice with “The Man Your Man Could Smell Like”), have ridden memes very successfully (like Volkswagen with “The Force”), or have created Epic Ad content that uses storytelling to engage audiences (like Heineken with “The Entrance”) and strive to create similarly resonant content: online video creatives will see higher production and distribution budgets.
As brands spend more time and money on social video, the analytics and insight they need to see around this content will become more and more important.
Brands will be looking for insight into exactly who is watching and sharing their videos, including demographics, real time brand uplift metrics; and benchmarking by category.
Understanding the true sentiment behind comments at scale will also become increasingly important for advertisers as more users engage and interact with branded content.
Social video bridges the gap between content consumption and ad spend.
Social video campaigns generated 820m views in 2009, 2.7bn views in 2010, and over 8bn views in 2011. We are likely to see the number of views delivered from social video campaigns more than double again in 2012. - David Waterhouse, eConsultancy
Videos made easy, effective and affordable.
Get started today! Call VMakers - 888.712.8211, info@VMakers.com
VMakers.com
The "Hollywood" Studio Pros
The team behind your favorite shows and movies, including: Ellen, Seinfeld, Whitney, How I Met Your Mother, Chelsea Handler, The Disney Channel and more.
So what does 2012 hold for online video?
Here are some predictions from Unruly Media's 'What's next for social video?' insight report...
1. Video culture: what will people be watching?
Memes will spring from unexpected places throughout 2012 as they have for years but, as always, momentous events will provide a springboard for meme culture.The US Election and the Olympics will be meme playgrounds, and memes are also likely to spring from End of the World predictions as December 21 approaches: it’s the end of a 5,125-year-long cycle in the Mesoamerican Long Count calendar which has been the centre of speculation in certain circles.
Brands will be anticipating the memes, themes and Olympian dreams of 2012, creating video content around key events, and epic ads that use storytelling to engage and build long-term connections with audiences, as with the Heineken content of 2011.
People will be creating and watching more user/community-funded films in 2012, with companies like Kickstarter providing independent film makers with access to funding, and video tools from YouTube and others boosting the quality of user generated content.
Brands will do more to encourage audience participation and interaction both by using their audiences to create content via competitions, and by introducing interactive functionality alongside their video content.
Alongside epic, high quality content, fast/sticky/funny content will persist in video, and extend via GIFs.
Video and images are the key components of meme propagation online and simple GIFs are likely to become fancier and spread more readily as a midpoint between video and images.
GIFs behave as video shorthand and will become a more common form of expression in 2012 thanks to free downloadable and web-based programmes for GIF creation and opportunities to post GIFs on Tumblr, Google+ and new GIF sites.
2. Device proliferation: where will people be watching?
While people will continue to consume social video on PC & desktop computers, and while Connected TVs will gain traction, significant and increasing numbers of people will be watching social video on phone and tablet mobile devices.Mobile is the fastest growing information & communications technology ever seen (Figure 1) and mobile penetration will continue to grow in 2012.

Figure 1
Source: ITU World Telecommunication / ICT Indicators database. *2011 data is estimated.
Developed economies
Cross-platform consumption of video content will become the norm, and since sharing is intuitive on mobile devices, cross platform social video will reach the mainstream.A ‘best available device’ culture will emerge, which sees users demanding the content they want, when they want it, on the best screen they happen to have to hand at that moment.
This is already happening, and providers of content by subscription, from the Financial Times to AppleTV are selling cross-platform subscriptions to allow content to be pulled from the cloud onto multiple devices.
This culture is likely to lead to the introduction of a ‘Continuous Client’, a term coined by Joshua Topolsky of Engadget in 2010, which describes full synchronicity between multiple devices so that the work done on a phone, tablet or PC follows a user around as they switch to other devices.
As Topolsky says: "your devices (and their clients) should talk to each other so that you can placeshift your session from screen to screen".
Figure 2 shows that ad campaigns that have been run across two platforms perform better than those that have been run across a single platform: with data like this and users consuming media across multiple devices, brands will increase their cross platform ad spends significantly in 2012.
As brand budgets follow the audiences to mobile, blending of brand video delivery across online, mobile and TV platforms will become commonplace.

Figure 2
Nielsen Cross Platform Behaviour, September 2011
Brands will also start embracing multi-screen consumption, engaging with the companion screen to create content which is designed to complement a TV-type viewing experience.
Users are already using the companion screen while watching TV, and in 2012 more brands, particularly broadcasters, will come out with companion content designed for smartphones and tablets.
Now that smartphones increasingly have 3D and Augmented Reality (AR) delivery capabilities built in, there will be a jump in the amount of commercially produced 3D and AR content in 2012, especially as 3DTV proliferation increases.
Entertainment and top FMCG brands are likely to lead this charge. Juniper Research predicts that AR mobile revenues will jump from $2m in 2010 to $1.5bn in 2015.
As new smartphones and tablets hit the market with increasingly diverse features, from advanced camera technologies to temperature sensors and barometers, new features are likely to become a springboard for innovations from native application developers.
Developing and supporting native applications for multiple devices and operating systems is time consuming and expensive. Brands have a need for quality HTML5 functionality which allows them to support features cross platform.
Emerging economies
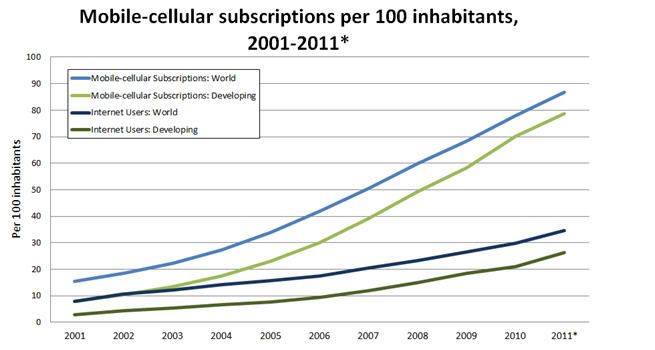
Figure 3
Source: ITU World Telecommunication / ICT indicators database. Developed / developing country classifications are based on the UN M49. *2011 data is estimated.
Figure 3 shows that emerging markets are seeing a much faster and wider adoption of mobile devices than of internet connected desktop and laptop devices, and that increasing mobile subscriptions are impacting the growth of web use(slightly but significantly) in those markets.
These trends result from the ability to access connectivity at a much lower cost via mobile devices. For example, Aakash, a tablet device launched in India, is being sold to students at the subsidised price of $35, and are likely to continue in emerging economies over the coming years.
Affordable mobile technology is becoming a work platform and a revenue generator for people in emerging economies.
For global advertisers, this means new markets are opening up: direct-to-consumer channels are becoming available in territories previously difficult to reach, such as India and Africa.
India’s current internet penetration stands at 6.6% of the population but is predicted to reach 29.5%, with the number of Indian smartphones set to top 450, by 2015 .
3. Social platforms: how will people be sharing?
As well as the ‘Big Four’ social platforms of 2012 (Facebook, Twitter, YouTube and Google+) social gaming environments will play a larger role in video sharing, as will the already powerful presences of region specific social platforms such as RenRen in China and VKontakte in Russia.The advent of social video viewing platforms like Shelby.tv and VHX may begin to change the way people discover, consume and share social video content.
These platforms are designed to turn Twitter, Facebook and Tumblr into TV channels, where you can discover and watch all of the videos your friends are sharing and talking about in real time.
They facilitate a dedicated social video experience, and may be more widely used in 2012.
On Facebook for the mobile web or iPad, if you tap on a story that a friend has posted in your newsfeed relating to an app, Facebook will fast-app-switch you over to the app if you already have it, or it will deep link you to the app store to download the app if not.
This functionality tries to be device-appropriate: if you’re viewing from an Android device, it will direct you to the Android app if possible.
HTML5 apps are not mainstream, so it’s essential for Facebook to fully support native applications. However, the current solution takes users out of the site and out of Facebook’s control, so it is unlikely to be a long term fix.
The leaked Project Spartan, a Facebook developer platform designed for mobile apps in HTML5, may be released in 2012 as a longer term play from the company as HTML5 becomes more developed and functional.
Twitter owns a lot of data around the number of clicks in a given time period, and may use this real-time link tracking to introduce real-time targeted ads.
YouTube
YouTube has introduced video tools to make video editing easier for users, which are likely to increase the quality of the video content on the site.The trend towards live content and on-demand services on YouTube will continue as Connected TV and TV on Demand blur the lines between TV and online.
Also, there are likely to be more pay-per-view partnerships between YouTube and broadcasters. For example, the Ultimate Fighting Championship made all of the main card fights from UFC 135 available live for fans in the U.S. on the UFC YouTube channel for $44.99.
Google+
Google+ is similar to Twitter and Facebook in many respects, but Hangouts are a differentiator.Hangouts have the potential to become a hub for real-time socialised co-viewing, perhaps particularly around video classes, and Google+ may increase focus on social viewing via hangouts in 2012.
Social gaming
Social gaming will become even more mainstream in 2012. In the early days of social gaming, the common perception of social gamers was that they were all teens and tweens.A little later, with the rise of Facebook games, the average social gamer was a 43-year-old woman, and by 2011, the largest demographic was 25-34 males, with females not far behind (Figure 4).
By 2012, there will be 68.7m social gamers in the US, and already 92% of smartphone owners play mobile games weekly.
Within social gaming, value exchange advertising will be huge. Value exchange allows brands to reward users for engaging with their content, presenting a positive experience for users at the time that they choose to interact, and freeing them from annoying ‘ads’ during gameplay.
Engaging with users when they are gaming allows advertisers to reach users in their downtime when they have time to engage with content: sharing it, clicking through for more information and commenting on it if they find it interesting.
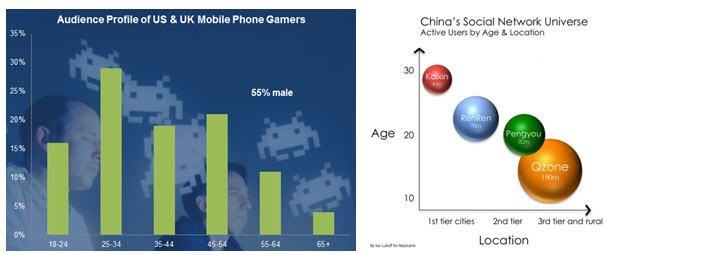
Figure 4 Figure 5
Popcap Research, September 2011, Mashable, March 2011
Local social platforms
While the Middle East and North Africa will be loyal to Facebook and YouTube, J-BRIC (Japan, Brazil, Russia, India and China) will continue to engage increasingly with local video platforms and social networks, including Mixi in Japan, VKontakte in Russia, and Orkut in Brazil and India.China’s use of social platforms is increasing and the most popular platforms tend to be homegrown, largely because Facebook, YouTube, Twitter, Google+ and many other platforms are banned in China.
Youku is the top Chinese video sharing site, Sina runs the biggest blog and microblog community, and China’s various social networks are illustrated in Figure 5.
Global brands will have to start tailoring social plans to make use of these international social platforms, in order to have success around the world.
4. Brands and video in 2012
Social video is emerging as the format of choice for planners and strategists with an eye on the long game.The honeymoon for the 15-second pre-roll ad is coming to an end as advertisers demand better execution and cut-through and move budgets from push formats towards pull solutions; even pre-roll is starting to morph into an interactive multi-choice medium.
The pioneering brands of 2012 will be looking to brands that have created memes (like Old Spice with “The Man Your Man Could Smell Like”), have ridden memes very successfully (like Volkswagen with “The Force”), or have created Epic Ad content that uses storytelling to engage audiences (like Heineken with “The Entrance”) and strive to create similarly resonant content: online video creatives will see higher production and distribution budgets.
As brands spend more time and money on social video, the analytics and insight they need to see around this content will become more and more important.
Brands will be looking for insight into exactly who is watching and sharing their videos, including demographics, real time brand uplift metrics; and benchmarking by category.
Understanding the true sentiment behind comments at scale will also become increasingly important for advertisers as more users engage and interact with branded content.
Social video bridges the gap between content consumption and ad spend.
Social video campaigns generated 820m views in 2009, 2.7bn views in 2010, and over 8bn views in 2011. We are likely to see the number of views delivered from social video campaigns more than double again in 2012. - David Waterhouse, eConsultancy
Videos made easy, effective and affordable.
Get started today! Call VMakers - 888.712.8211, info@VMakers.com
VMakers.com
The "Hollywood" Studio Pros
The team behind your favorite shows and movies, including: Ellen, Seinfeld, Whitney, How I Met Your Mother, Chelsea Handler, The Disney Channel and more.
Subscribe to:
Posts (Atom)